NiX Spectro 1 in-depth
Calibration Tile — Fluorescent Effect
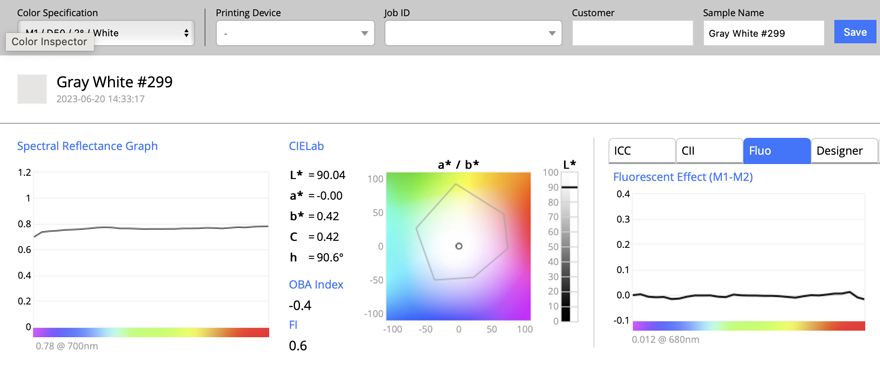
This test shows that OBA Index has a negative value, Fluorescent Index is 0.6, which is not expected as most calibration standards have no OBAs and FI =0
Fluorescent effect points 680 nm, fluorescence curve is not smooth - that is showing a kind of data processing that is not optimized on the self-calibration tile.
BCRA White Tile — Fluorescent Effect
To eliminate the problem of the unknown instrument's white standard, a White BRCA from Lucideon is used for a deeper evaluation.
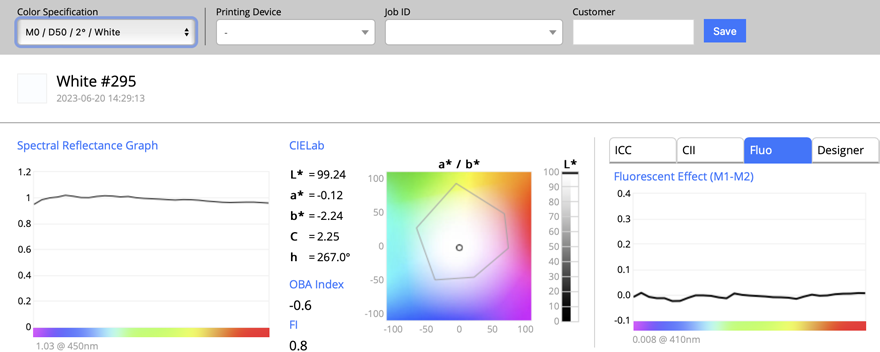
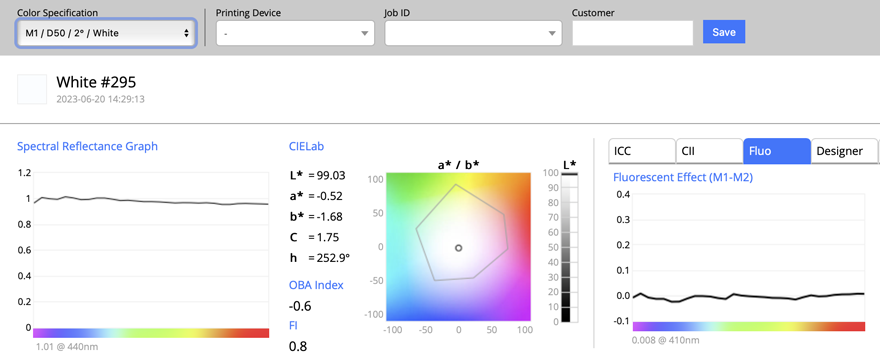

This test proves the hypothesis. White BRCA has OBA Index = 0, Fluorescent Index = 0, spectral curves are identical for all M-conditions and are very smooth. NIX produces some unexpected differences for all M-conditions.
This instrument is not recommended for paper measurements to detect OBAs
Short-term repeatability: 9 measurements of white calibration tile.
This test has been repeated a couple of times.
| 1 | 2 | 3 | 4 | |
| 95 percentile M0 | 0.25 | 0.23 | 0.24 | 0.12 |
| 95 percentile M1 | 0.19 | 0.31 | 0.24 | 0.18 |
| 95 percentile M2 | 0.19 | 0.17 | 0.19 | 0.10 |
| max error M0 | 0.27 | 0.24 | 0.29 | 0.17 |
| max error M1 | 0.19 | 0.35 | 0.27 | 0.23 |
| max error M2 | 0.19 | 0.18 | 0.24 | 0.15 |
| average error M0 | 0.12 | 0.11 | 0.11 | 0.06 |
| average error M1 | 0.09 | 0.14 | 0.12 | 0.10 |
| average error M2 | 0.09 | 0.09 | 0.09 | 0.05 |
This test shows that M2 measurements are more stable than M0 or M1. As the number is not very small, we decided to make another test with more samples.
Short-term repeatability: 100 measurements of white calibration tile.

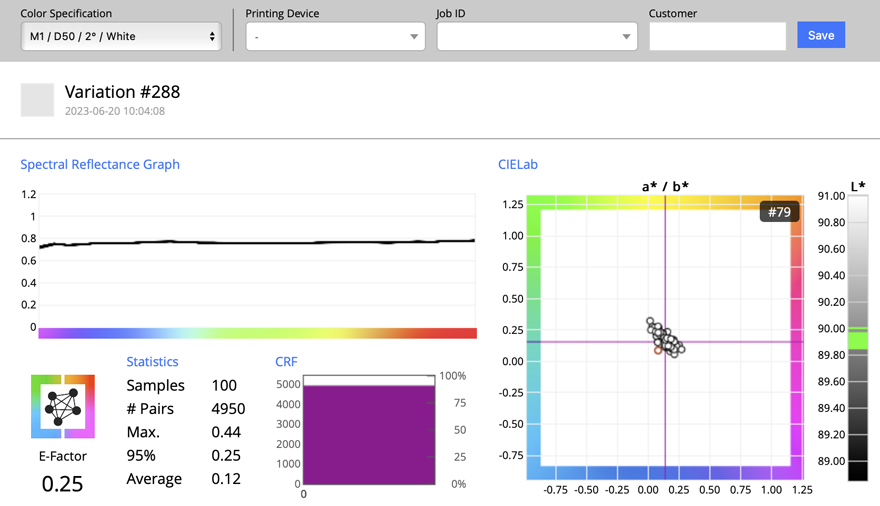
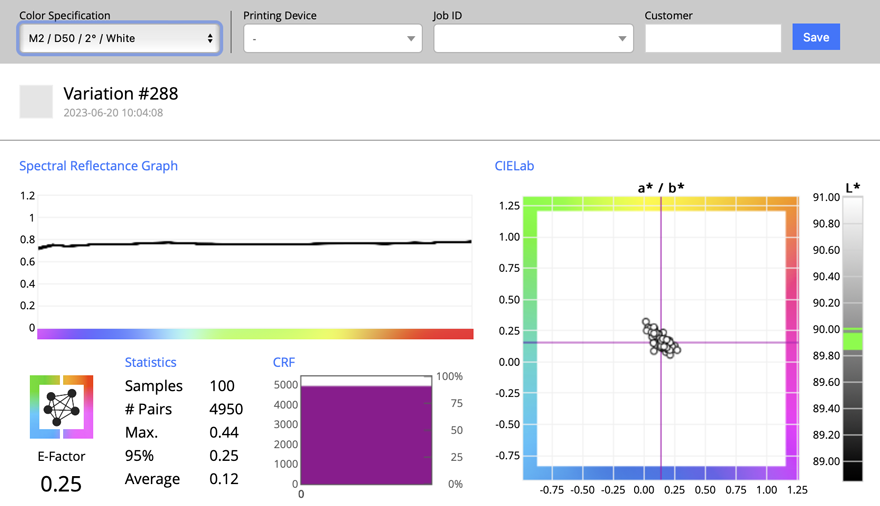
All Variation analysis shows results that can show an average value of around 0.10, which can be expressed as ±0.05 and is what the manufacturer declares.
Short-term repeatability: 9 measurements of Black BCRA
This test has been repeated a couple of times.
| 1 | 2 | 3 | 4 | 5 | |
| 95 percentile M0 | 0.26 | 0.33 | 0.32 | 0.21 | 0.27 |
| 95 percentile M1 | 0.45 | 1.20 | 0.75 | 0.52 | 0.77 |
| 95 percentile M2 | 0.23 | 0.25 | 0.23 | 0.29 | 0.36 |
| max error M0 | 0.35 | 0.37 | 0.37 | 0.23 | 0.33 |
| max error M1 | 0.50 | 1.26 | 0.80 | 0.61 | 0.89 |
| max error M2 | 0.30 | 0.38 | 0.38 | 0.31 | 0.43 |
| average error M0 | 0.15 | 0.19 | 0.20 | 0.13 | 0.17 |
| average error M1 | 0.23 | 0.52 | 0.35 | 0.23 | 0.38 |
| average error M2 | 0.14 | 0.16 | 0.14 | 0.16 | 0.19 |
Generally, a Black sample produces much higher variations. It is essential to understand that no manufacturer is declaring short-term repeatability on Black.
Accuracy for black is for all instruments lower than for white
Contact ChromaChecker Support
Additional information and Support Form is available for logged users.