Choosing the Right Instrument
Most measurement instruments in the print industry are designed to measure printed substrates specifically. But with the versatility of being able to print on virtually any type of surface, the limitations of the measurement devices ability to accurately measure how the eye sees the given color on the unusual surface is causing problems related to implementing a quality measurement process to ensure the printed result is accurate and repeatable. Multiple variables significantly affect how a measurement device represents the given sample. Variables such as high gloss finish, structural effects, pearlescence, mirrored material (foil, silver, gold), metal, aluminum, and other complex materials can cause the instrument to not render the result as the human eye expects.
The purpose of this white paper is to provide a practical methodology that can be followed to ensure that the instrument is capable of measuring the desired sample in a consistent and accurate way that represents how the human eye perceives the color. The analysis of the result will allow you to compare different instruments with each other and indicate which one will be the best for a given task. It is worth noting that it is not always the most expensive instrument which is the best. Sometimes the least expensive instrument proves to be the most effective for a specific task.
You can educate yourself on the differences between instrument optics and measurement types and try to determine the best one, but as experience most often proves, nothing replaces quick and smart methodology performing actual measurements. In this white paper, we provide a quick, smart methodology that you can follow in performing actual measurements with your materials to quickly determine which instrument will be the best for your given application.
This tested methodology is based on instruments performing a spot measurement function using ChromaChecker's "Start Variation" function built into the CC Capture program. This methodology will help users determine which is the best instrument for a given sample.
Before starting, inspect the samples that need to be measured based on subjective visual observation. Do samples visually change color based on the angle of illumination and observation? Does the surface structure change the visual result based on the angle of observation? Some materials make it difficult to obtain repeatable measurements because our eye interprets color differently based on illumination and observation angles.
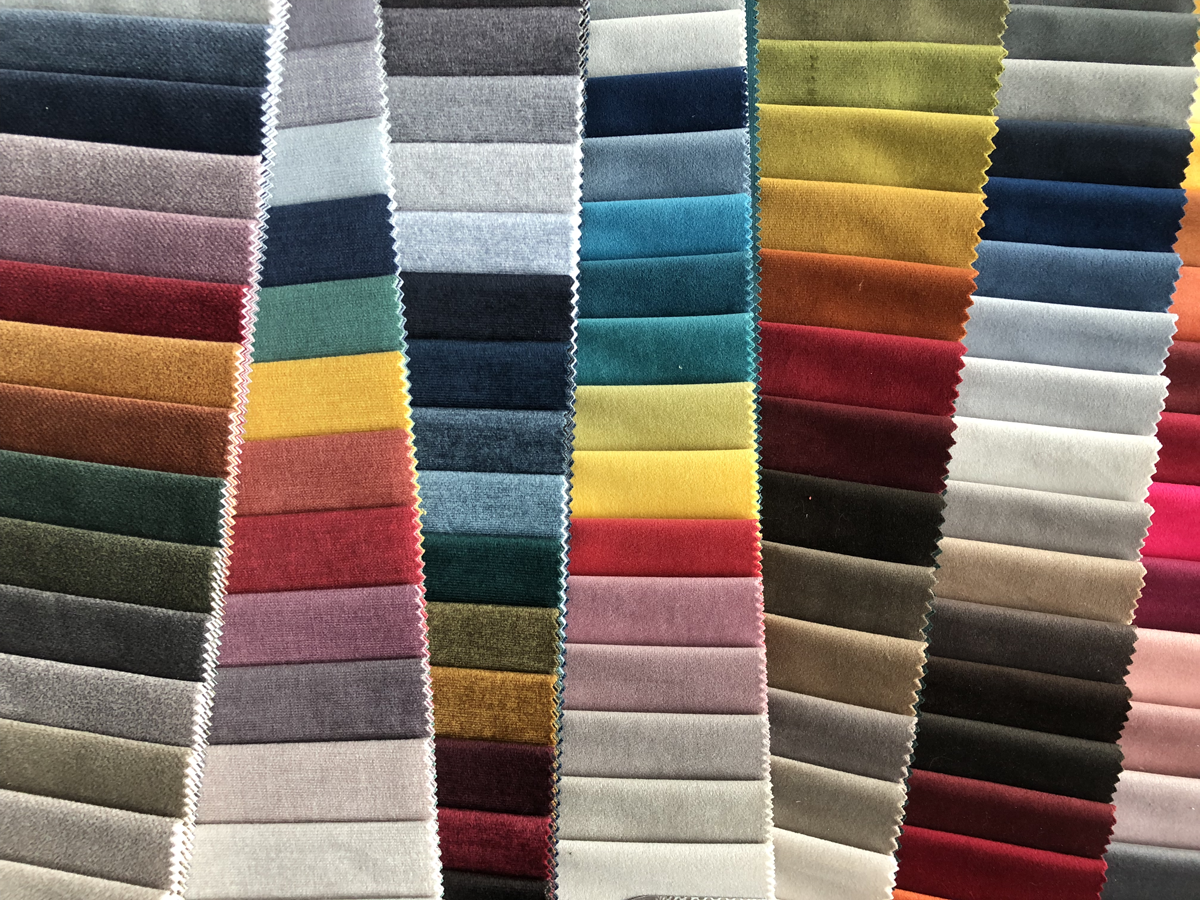
For this white paper, the methodology will be applied to velvet fabric samples, but the methodology can be applied to any other type of sample.
Three-step methodology — results in a couple of minutes
The ChromaChecker methodology requires a simple 3-step procedure:
| Step 1 | Step 2 | Step 3 |
 |
 |
 |
|
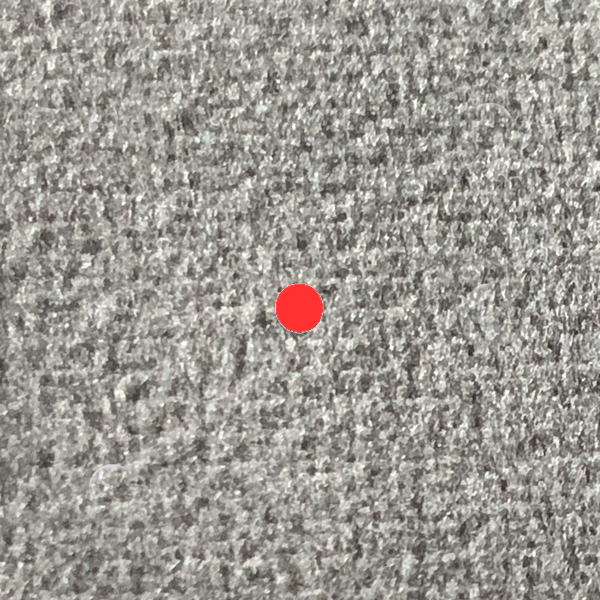
In this step, a single location is measured 12-16 times in a row without any displacement to see the short-term repeatability of the instrument. To avoid micro shifts (no movement of the instrument), a software button from CC Capture triggers measurements remotely. In most cases, the differences are caused not by the sensor but by the light source illuminating the specimen. Voltage stability, temperature, and other parameters may affect data repeatability. This test shows how repeatable the instrument is. |
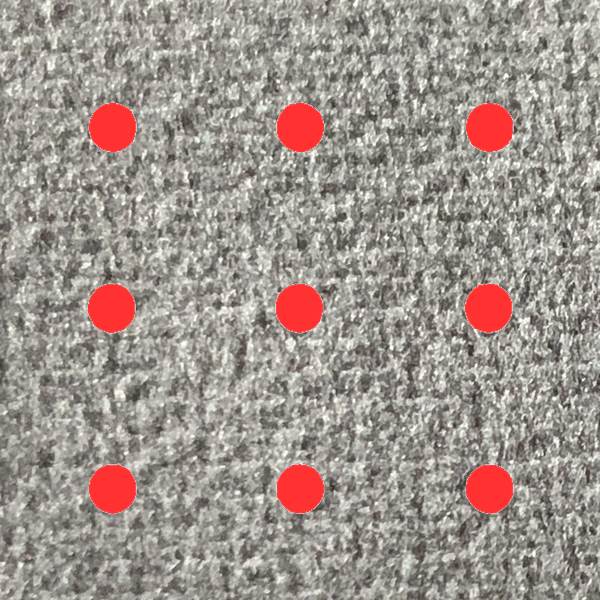
The purpose of this step is to check the natural non-uniformity of the object that is caused by non-randomly surface characteristics. In this step, the instrument is positioned in nine different locations. The offset is about 0.5 inch. Whenever we are doing tests, we should not expect zero difference as every measurement targets another part of the specimen. |
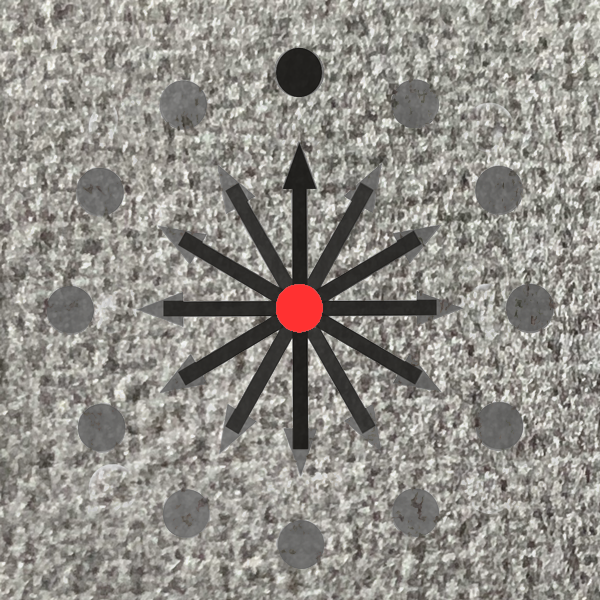
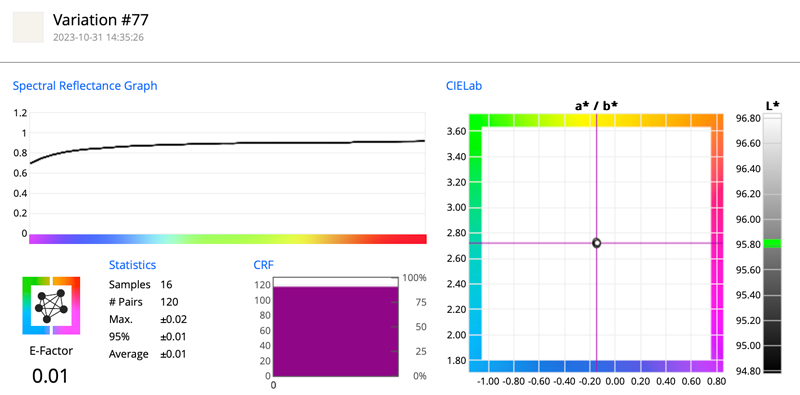
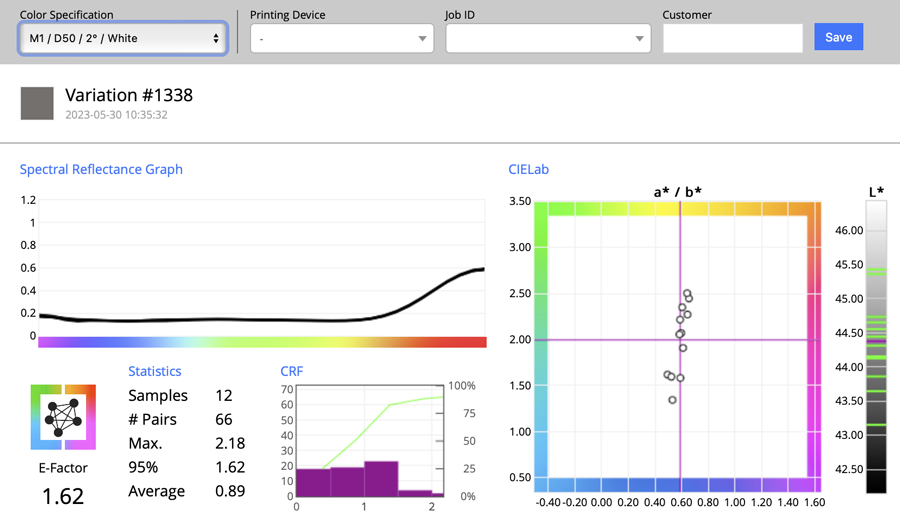
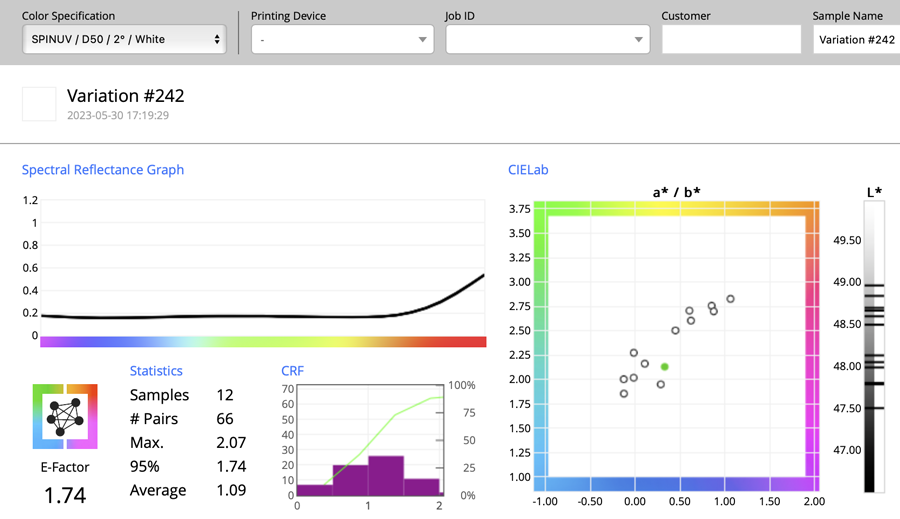
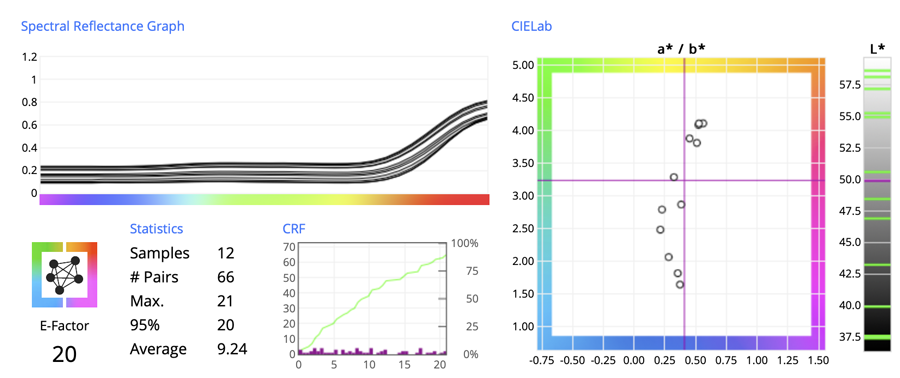
In this step, the fabric surface is combed in its natural direction. The only thing we will change is the rotation of the instrument. Using the QuickChecker Start Variation tool, we measure 12 times using an instrument rotated in 30° steps. The variation tool simultaneously reports 12 spectral curves and analyzes statistics for the distribution. The start Variation tool makes it possible to compare a series of measurements to themselves. Variation analysts compare all unique pairs. (12 measurements, computes to 66 unique pairs). E-Factor for 66 samples eliminates three worse pairs (95% percentile) and shows that 95% of the pairs are within the reported E-Factor delta E. |
Purpose of Step 1?
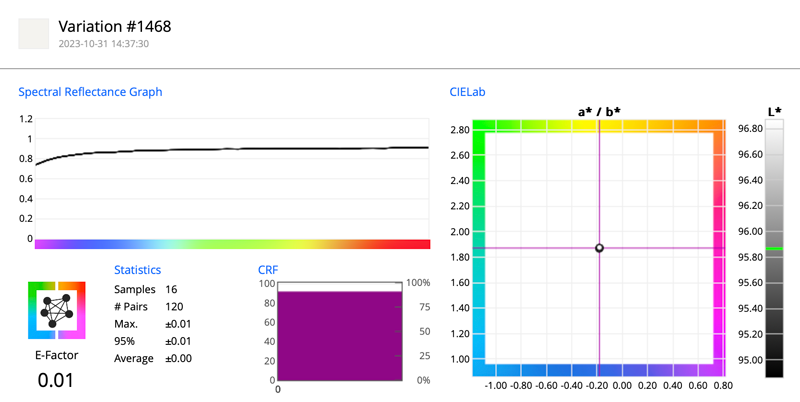
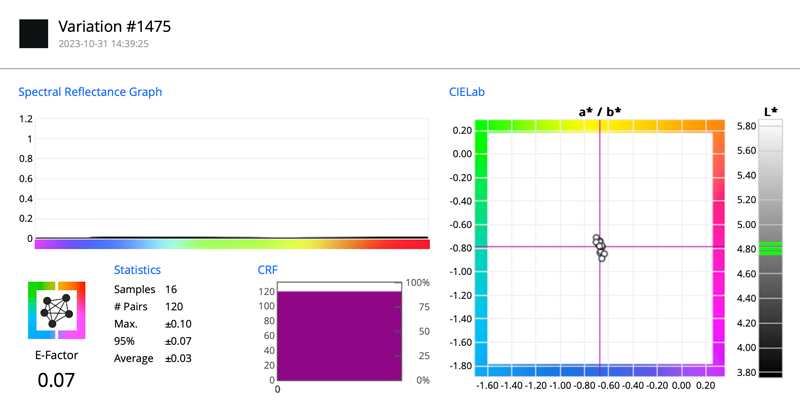
Most users think that the instrument is repeatable. We know that vendors are publishing short-term repeatability numbers, but they are based on the calibration white tile. Will the instrument be as repeatable if measuring black? If our specimen is dark, you should understand what portion of potential error comes from the instrument itself! The following example shows three different instruments, each measuring 16 times on a white sample and 16 times on a black sample. All measurements are triggered remotely without touching the instrument. This test takes a couple of minutes and gives you a more realistic picture of practical short-term repeatability for your instrument on a given type of color sample.
| Instrument X | Instrument Y | Instrument Z |
| White Calibration Tile | ||
|
|
 |
 |
| Black Glossy Sample | ||
|
|
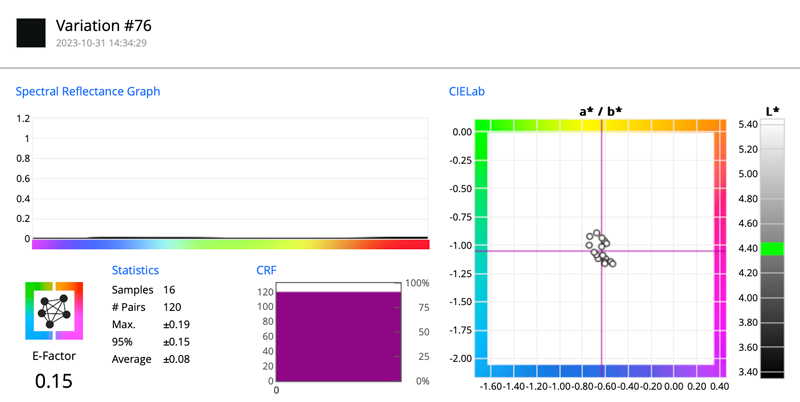 |
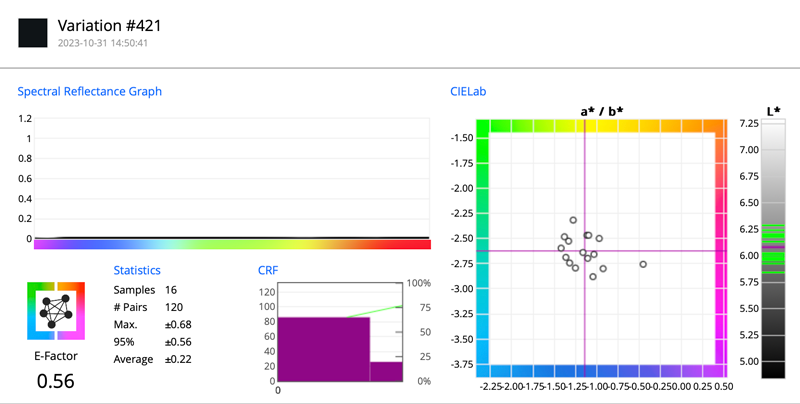 |
Whatever is promised by the instrument vendor can be easily verified by this simple exercise.
If the short-term repeatability E-Factor is around 0.5, you can dismiss using this instrument for tolerances with a fraction for delta E, like 2.5... It will only be accurate to integer numbers as your instrument is not accurate enough to distinguish fractions.
Step 2 – be sure to move the instrument without rotation!
| Instrument K | Instrument L | Instrument M |
 |
 |
 |
You may want to repeat this test using different apertures (if applicable). Start with very small movements (a few millimeters), and you may want to repeat with much larger displacements - your specimen might not manufactured with accuracy that will allow large displacements. The results of this test combine errors coming from real inhomogeneity and coming from inaccurate measurement (for example, to small aperture). You can find additional specimens that you trust are manufactured in a way that is uniform (in most cases, printed samples are not very uniform).
Step 3 – Rotation around the sample
| Instrument P | Instrument R | Instrument S |
 |
 |
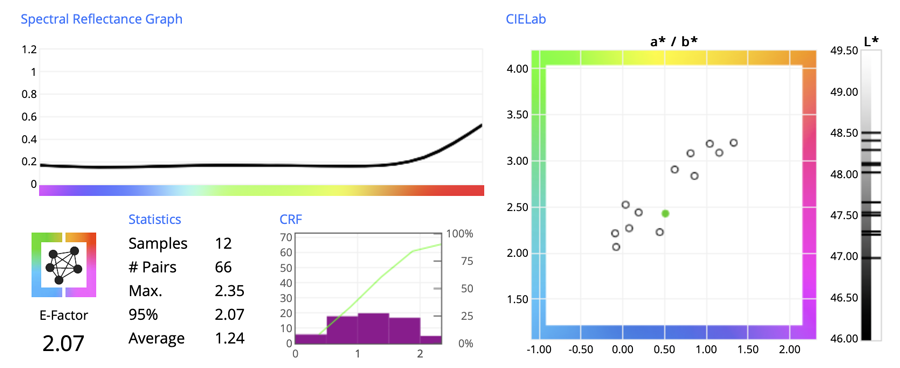 |
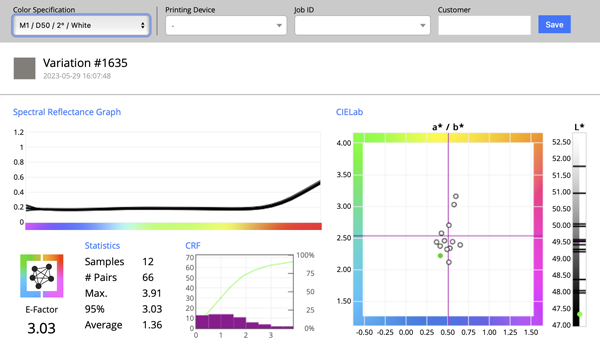
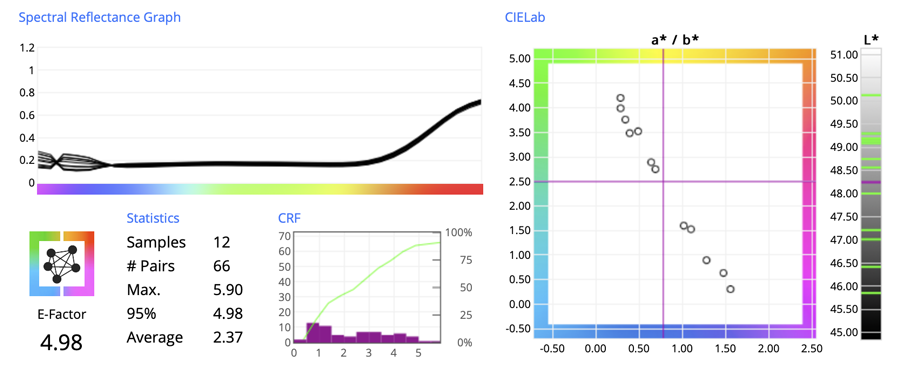
You can see huge differences in the E-Factor based on three different instruments measuring the same physical sample. The difference comes from differences in instrument geometry and illumination. The spherical instrument, with state-of-the-art optics and illumination via an annular ring, shows very low E-Factor numbers. Velvet is a kind of fabric that is very sensitive to angles, and measurement methodology can have a very large impact on the E-Factor of the instrument.
In this example, the worst E-Factor result comes from the ColorChecker Studio instrument. This instrument uses regular, non-annular 45°/0 geometry that can be applied to matt printed paper. This is an inexpensive instrument for print, not designed to measure complex uni-directional surfaces or textiles (also read: Brushed metallic surfaces).
What affects color?
Two surface-specific factors affect the color perception of velvet fabric:
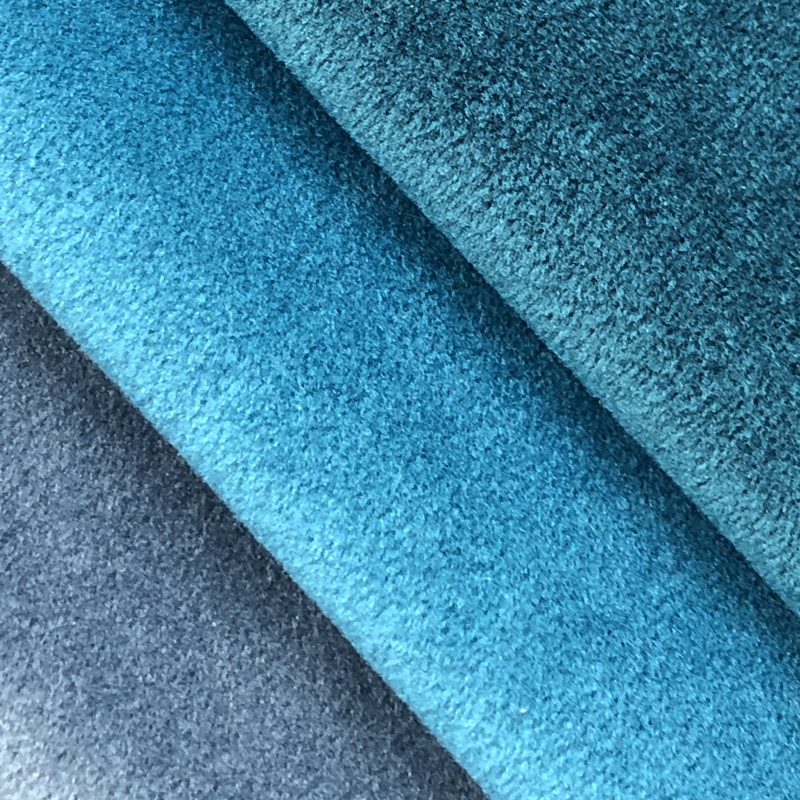
- The same material looks different depending on the lighting and viewing angles, even when the surface is brushed in one direction.
- Combing against the hair direction creates a fuzz and makes the color visibly darker due to the light of the instrument getting dispersed in the thicket of fibers and not making it back up to the instrument sensor. (Typical with a 45/0 instrument). It is the same situation when you mow grass in different directions. Grass appears to be different colors based on the direction of the mowing (laying down).
How do the human eye and instrument interpret objects?
Instrument geometry is a critical component of our test. Read more here.
The diagram below helps us understand the differences.
 |
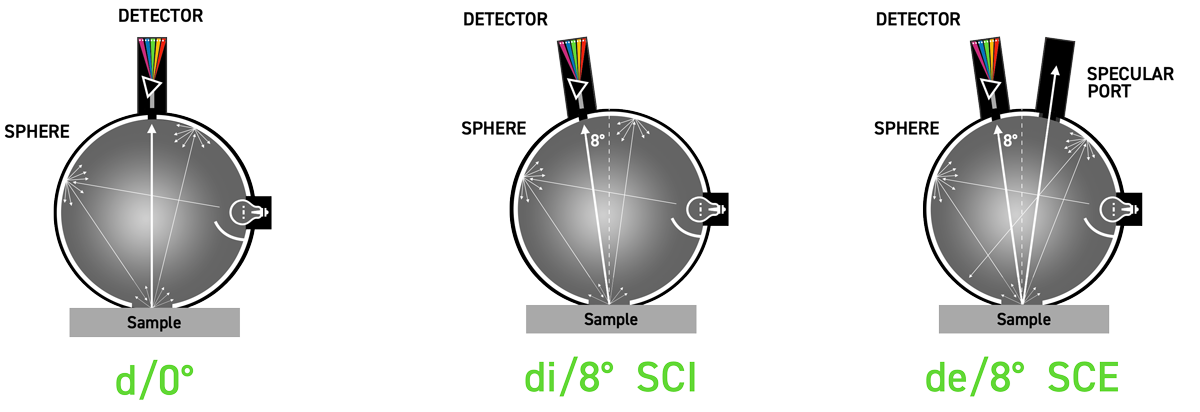 |
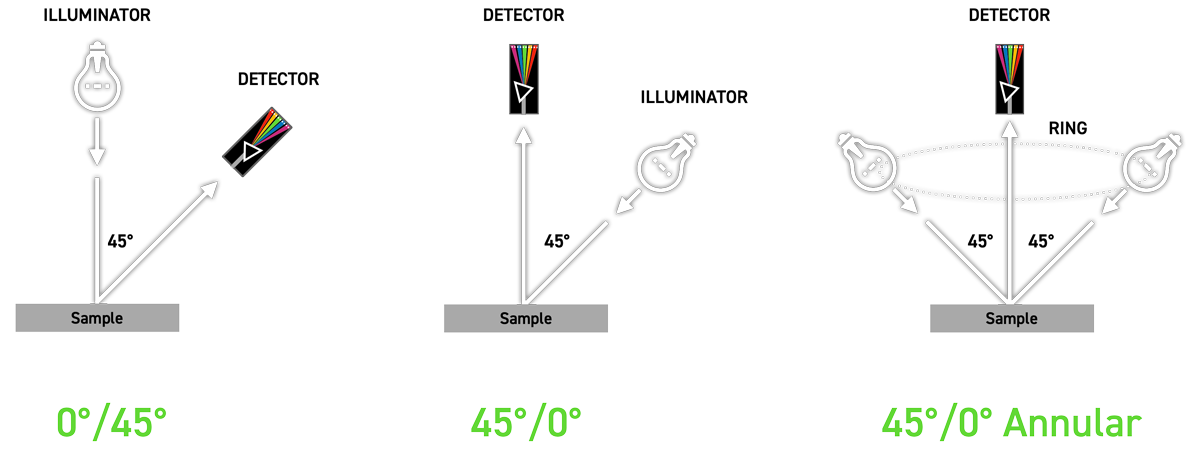
When measuring objects with angle-sensitive structures, you must consider the observation and lighting angles. Instruments that use the 45/0 geometry always look from above, and the light comes from a 45° angle. But this can cause spotlighting, which is very sensitive to the angle. A better option is to use annular lighting, which surrounds the object with light from all directions. However, not all annular illuminators are the same. Some manufacturers use a few LEDs on a circle and call it annular.
Please note that for the objects described in this article, geometry 0/45° (where light comes from the right angle end sensor is observing from 45° is extremely sensitive on an angle and is NOT recommended; therefore, an instrument like Techkon Spectro Dense cannot be used effectively for these tests. The human eye perceives significant differences when viewing from 45°, which the instrument does not pick up. Therefore, there is no good correlation between the eye and this type of instrument.
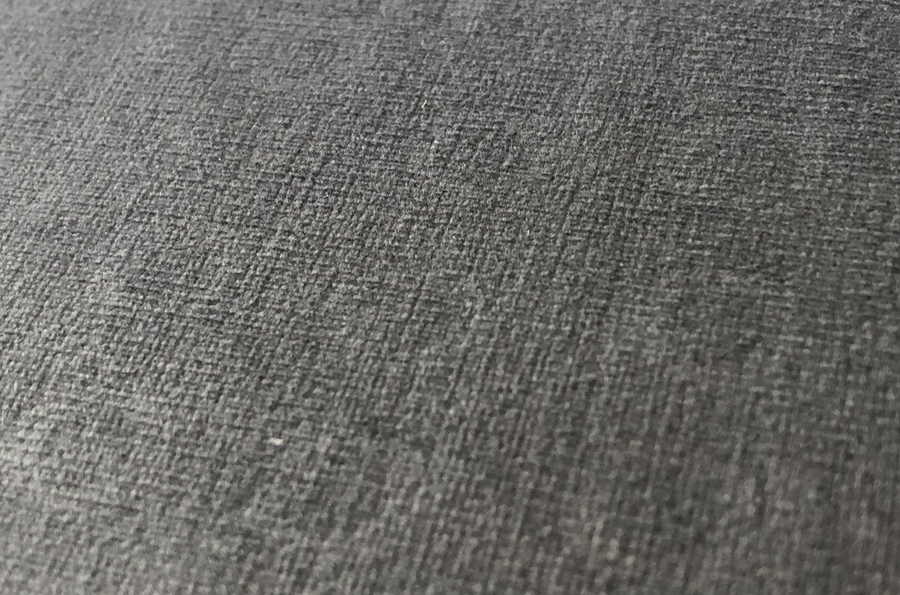
Close-up on velvet used in this test
In this article, we selected velvet-type fabrics. Fabrics based on weft and warp are almost always not indifferent to direction. The thread determines the angle critical for measuring the color of fabrics. This angle is similar to the appearance of your grass after being cut with a mower. Depending on which direction the grass was mowed, the color of the grass appears to be a different color, even though it is the same.
This article is helpful for anyone who wants to learn about the significant differences between the optical path, which determines how spectrophotometers measure color. We attempt to explain the challenges of measuring velvet-type fabrics in this article since many people do not realize how the geometry of a spectrophotometer affects the measurement results with these types of samples.
Velour, velvet, and the like...
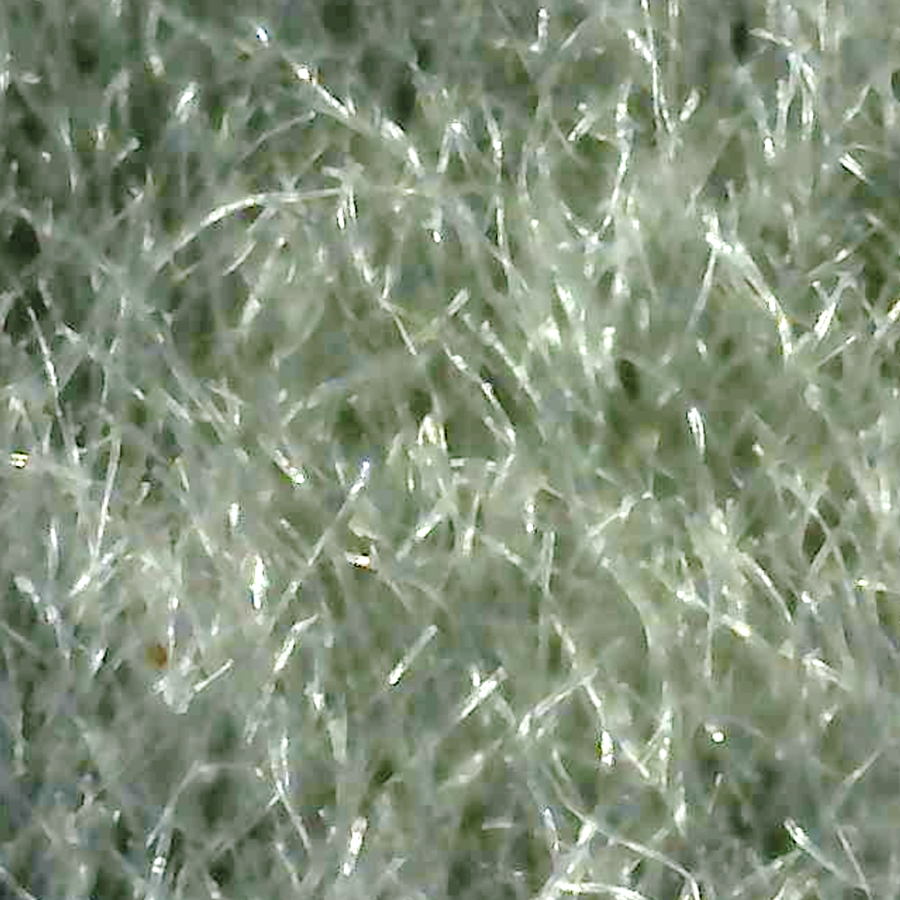
Velvet is a weft material, i.e., the weft threads are stretched over the warp in the form of loops, and when they are cut, hairs are formed. Velour has an additional warp (the warp is a system of threads that make up the fabric). However, the nap formed on the surface is not perfectly vertical during manufacturing; the fibers lay sideways. If we comb such a surface, the fluff will lie down or stand up depending on the direction with or against the hair. This will significantly change the optical characteristics of the surface and will significantly affect light reflection. Modern velours are most often synthetic materials made of polyester fibers. A single fiber in the microscale is shiny – however, their multitude and the fact that they are not straight makes the surface perceived as strongly matte.
 |
 |
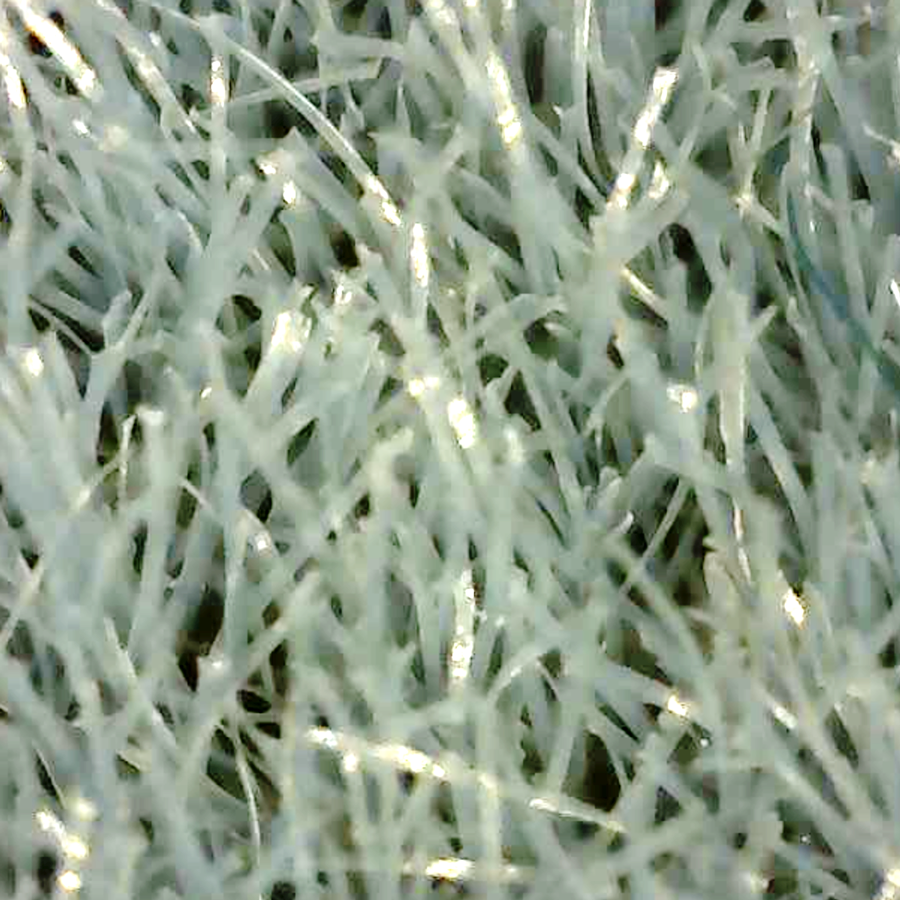 |
on the right: and close-up view using a microscope (two different types of velvet fabrics, same magnification)
General conclusions
- Fabric thread angles are very important and can affect the outcome significantly. For any evaluation, the method has to standardize it.
- Instruments are different, and select the one that is lowly sensitive to angles – spherical instruments or with the high-quality annular illuminator. Instruments based on 45°/0 geometry or using single or few-point-based illuminators may produce varied higher than expected.
- Each measurement leaves an imprint on the surface. For the next attempt, it has to be combed.
That shows that for some specimens, we need to have a repetitive method to prepare the surface.
- All instruments on the market have some pros and cons – but for a given task, some are better. We strongly recommend performing dedicated tests as the best method to find the best solution. Sometimes, the high-end instrument is designed for different kinds of objects, and less advanced instruments may work better.
Video
-
Second Tuesday Seminar - November 14, 2023
Contact ChromaChecker Support
Additional information and Support Form is available for logged users.