Metamerism, Color Inconstancy Index
Metamerism is a phenomenon that occurs when two colors appear to match under one lighting condition, but not under another. It is one of the most common sources of color complaints between print buyers and printers — and one of the hardest to diagnose without spectral data.
Objects
It is important to remember that color is a function of three elements: Object, Observer, and Illuminant.
The illuminated object has the ability to absorb or reflect light. It depends on the pigments on the surface and is different for electromagnetic waves of different lengths. When measured with a spectrophotometer a spectral curve is created to describe the pigments of the object that mathematically describes the object’s ability to absorb or reflect color in the spectrum.
 An object is perceived as blue (when illuminated by white light) when it has absorbed all wavelengths from the entire spectrum, except for the reflected ones — blue.
 An object is perceived as red when it absorbs most blue light, green light, and a certain amount of yellow light, reflecting red.
Lighting
For color specification, a Standard Illuminant is selected. The industry has a variety of standard illuminants defined by ISO standards.
In the real world, we have lighting that is different from D50 ISO Standards. The following diagram shows the Spectral Power Distribution Curve of D50 (green) and actual lighting in a plant (LED Neutral 4000K):
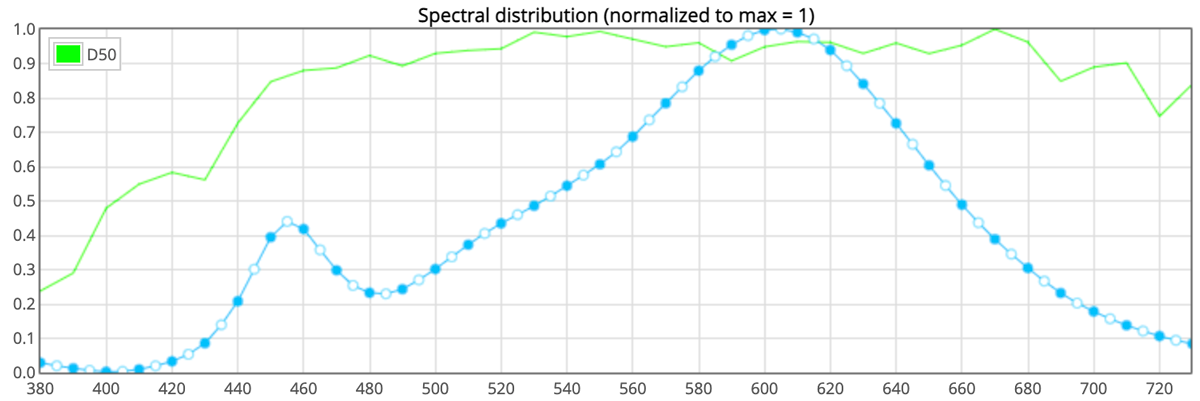
White D50 and LED Neutral 4000K are spectrally very different but due to the adaptation mechanism in which our brain compensates for the white point, the noticeable difference is fairly small.
An experiment
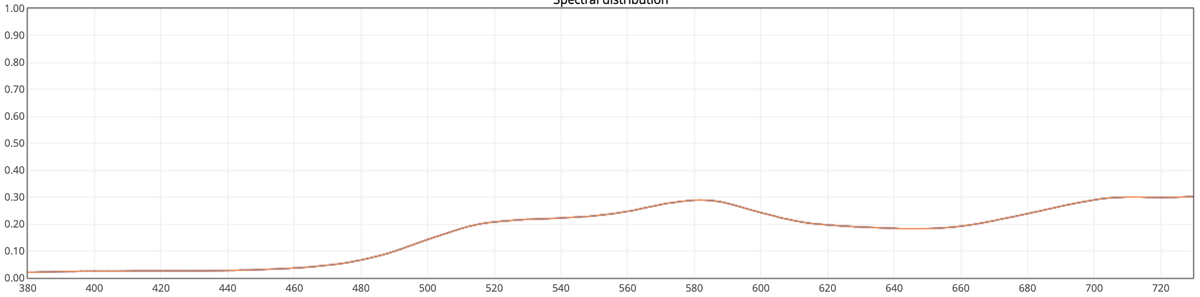
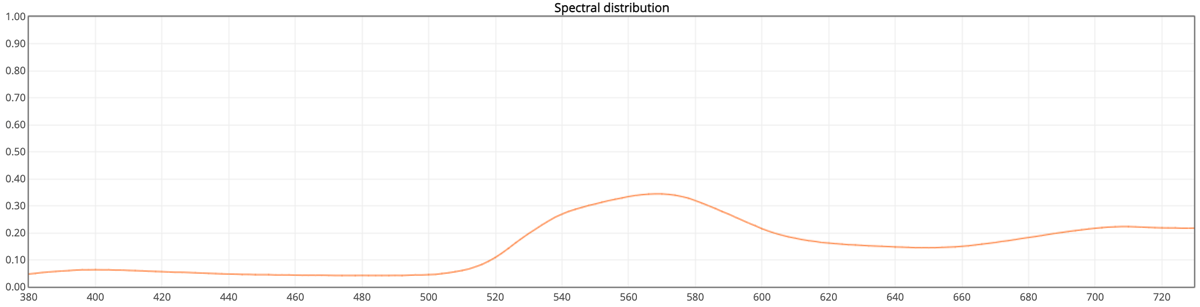
To demonstrate the influence of Lighting Conditions, we created the following experiment: two light sources were adjusted to produce a similar orange light. Thanks to PWM technology, RGB LEDs can be controlled and the operator can add/reduce components to balance RGB channels. After visual match was achieved, we used an i1Pro with ChromaChecker Lighting Inspector to capture the spectral (SPD) curves.
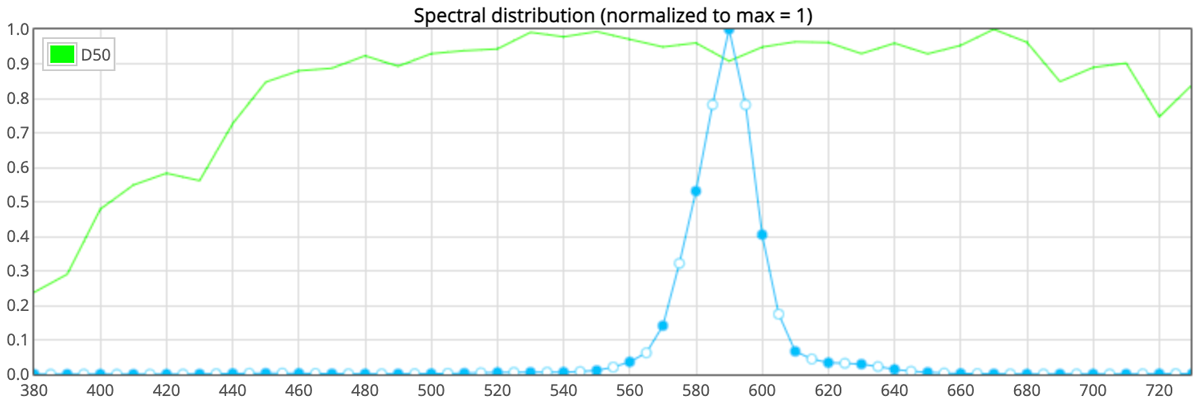
Sample 1. Orange LED
Sample 2. Orange RGB LED
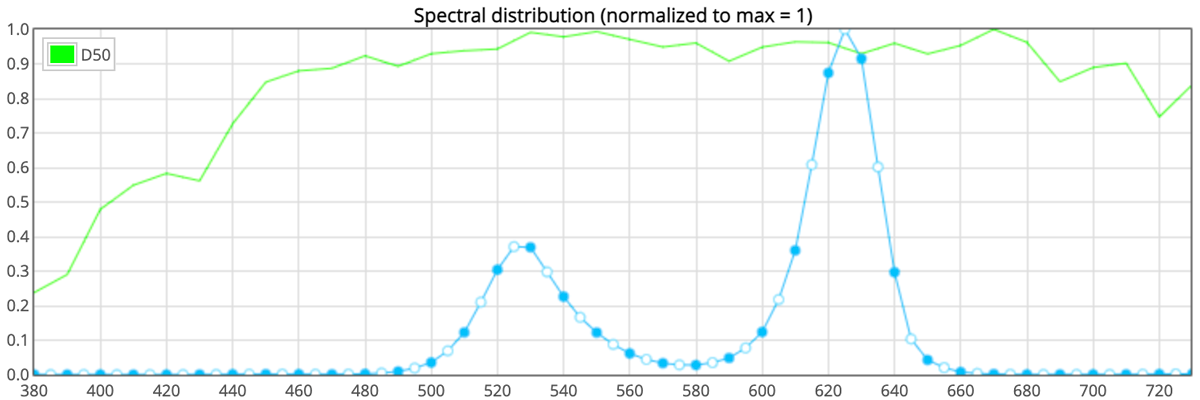
We can see that Orange LED SPD curve is described by a few hundred nanometers with a single peak at @590nm, while Orange RGB LED SPD has two peaks at @530nm and @625nm, and both peaks are wider, covering a wider range.
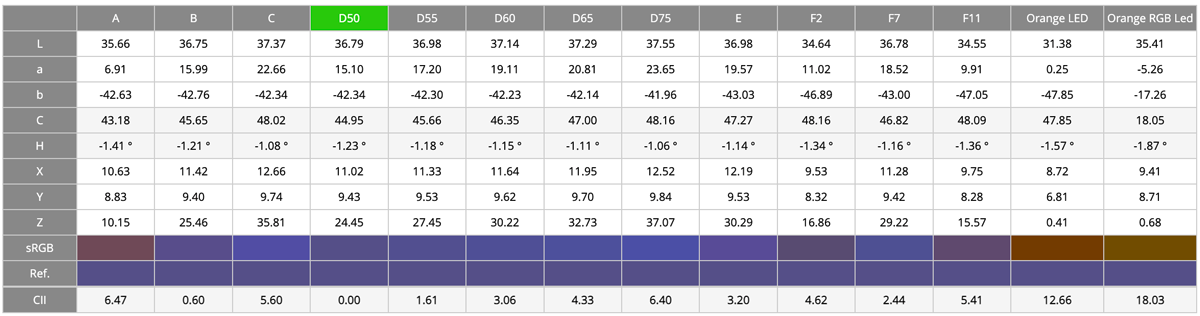
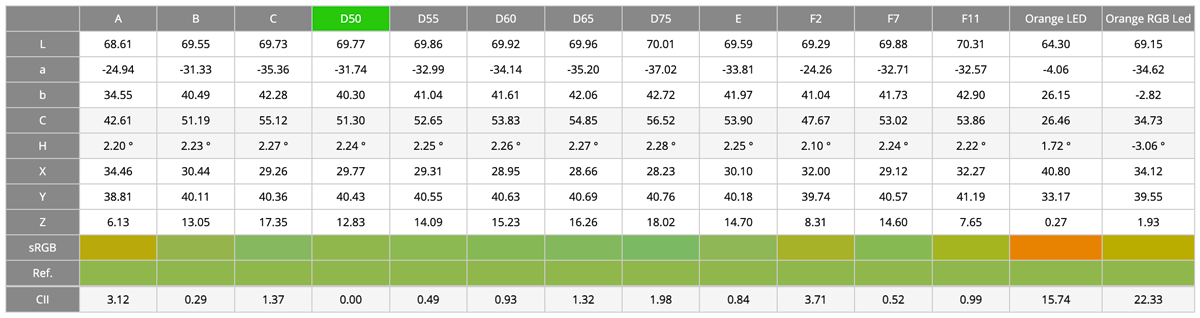
Color Inconstancy Index
This is a very important parameter that helps to understand the relation between Object and Lighting for the given Observer.
Color Inspector calculates this parameter for 12 Standard plus two custom Illuminants. In our example, we selected the Orange LED and Orange RGB LED as custom illuminants (the last two columns in the table below). This extreme lighting example produces very strong color deviations — and it makes the Color Inconstancy problem easier to understand. Narrowband lights are absorbed or reflected in very unique ways.
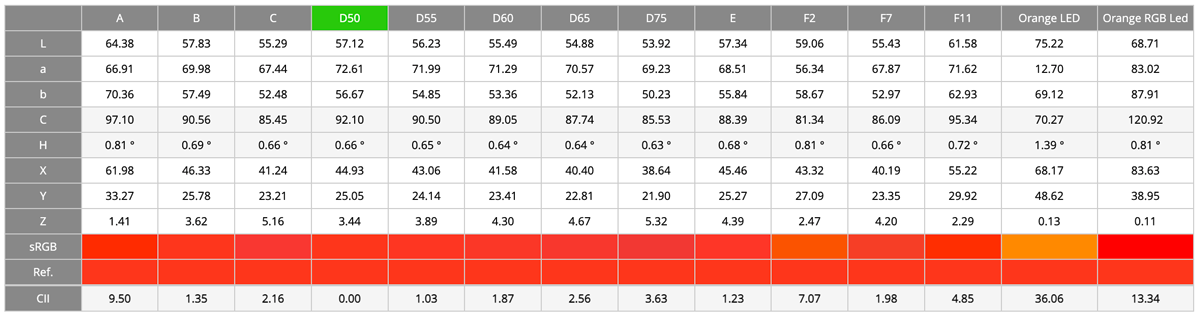
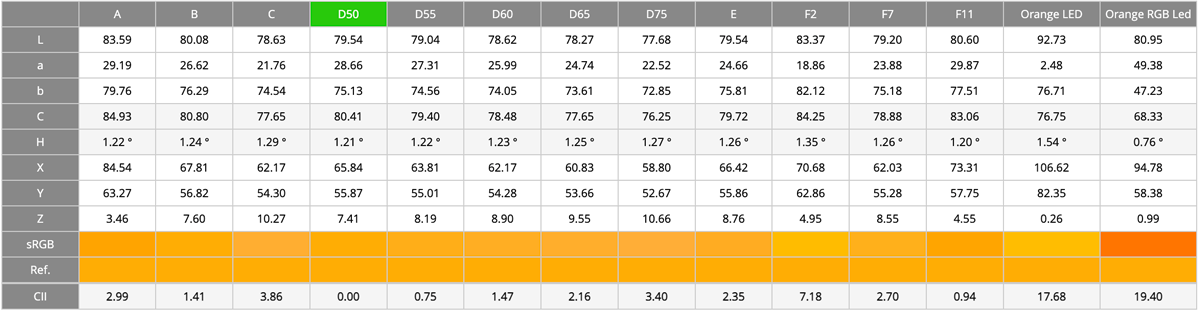
Review how different lighting conditions change how an object’s color is perceived. Let’s start with the Red and Blue objects which we described above.
Blue
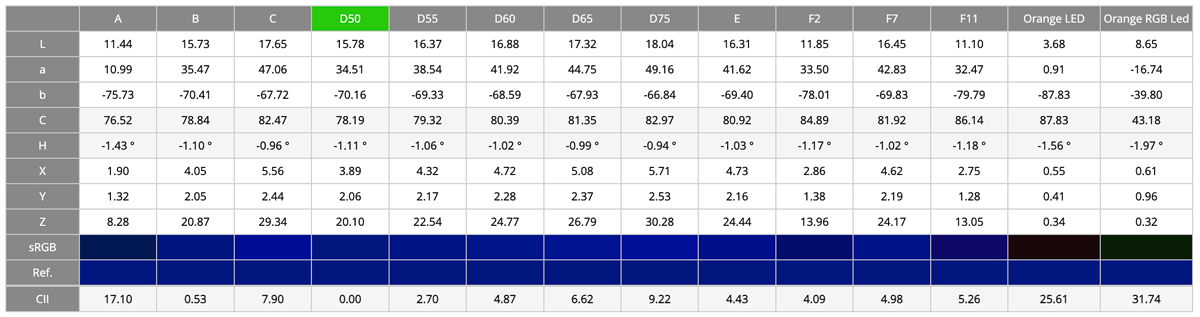
Illuminant A (tungsten bulb) gives us CII=17.1, for custom Oranges values are: 25.6 and 31.7 — our blue becomes almost black!
Red
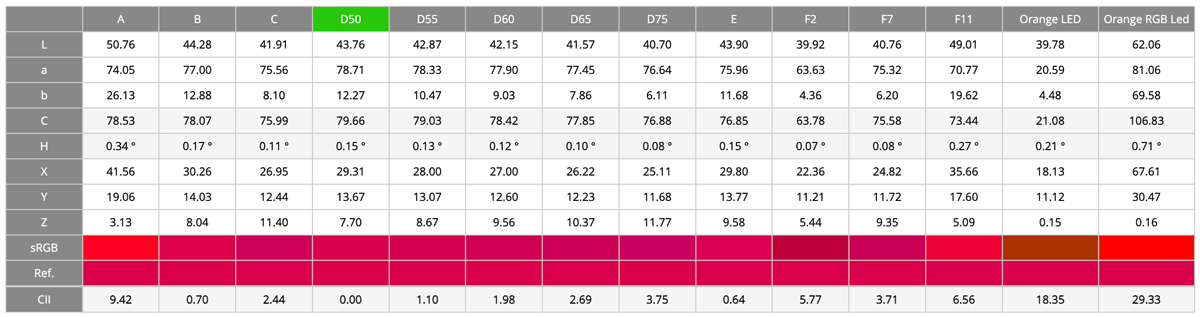
Narrowband Orange LED makes our sample brown, while RGB LED gives the impression of the lightest from the selection (L=62!).
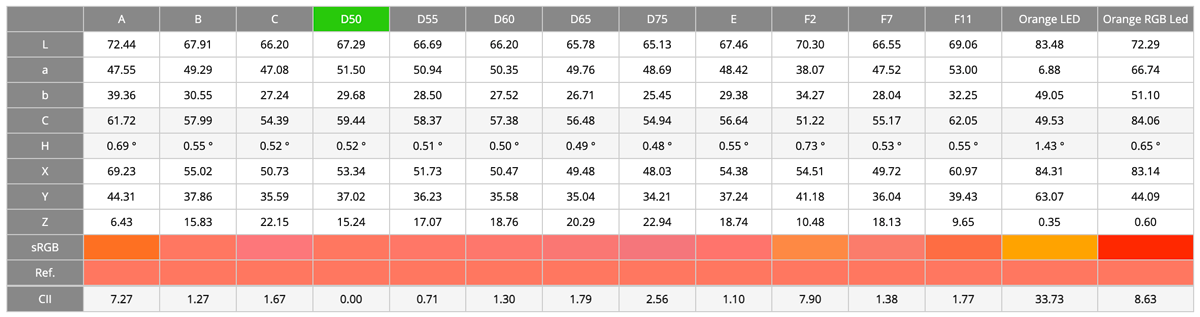
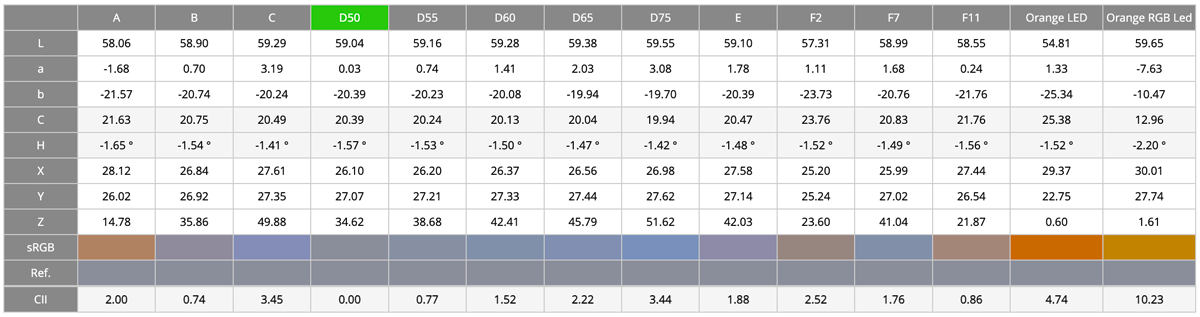
Additional samples from the color library can demonstrate even greater color shift due to various Lighting Conditions:
CC Capture is a very fast and effective tool for measuring both the object and the light (with the right instrument). Lighting Inspector can very quickly measure any custom lighting condition and Color Inspector can apply this lighting to any spectrally defined color within the Color Library. Color Inconstancy Index is a part of standard reporting.
CC Display (which calibrates and controls monitors) can also be used to measure the Lighting Conditions as well as the ability to manually upload LxF or other supported lighting file formats.
Note: Lighting Conditions are critical for color evaluation. ChromaChecker offers a variety of tools that make it easy to virtually evaluate any color sample at any custom lighting conditions. Understanding lighting is a key to the Metamerism issue.
Metameric Pair
We have analyzed two printed samples from Ugra Light Indicator — a simple tool for D50 evaluation — this is a practical solution where metamerism is used as a detection method.


If we use the same inks to paint objects, depending on lighting conditions we can expect the same issue.
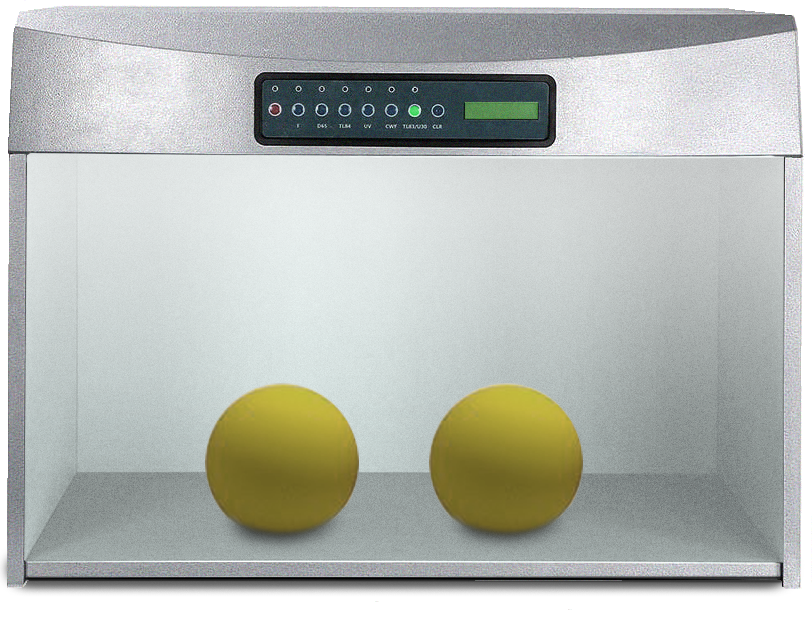
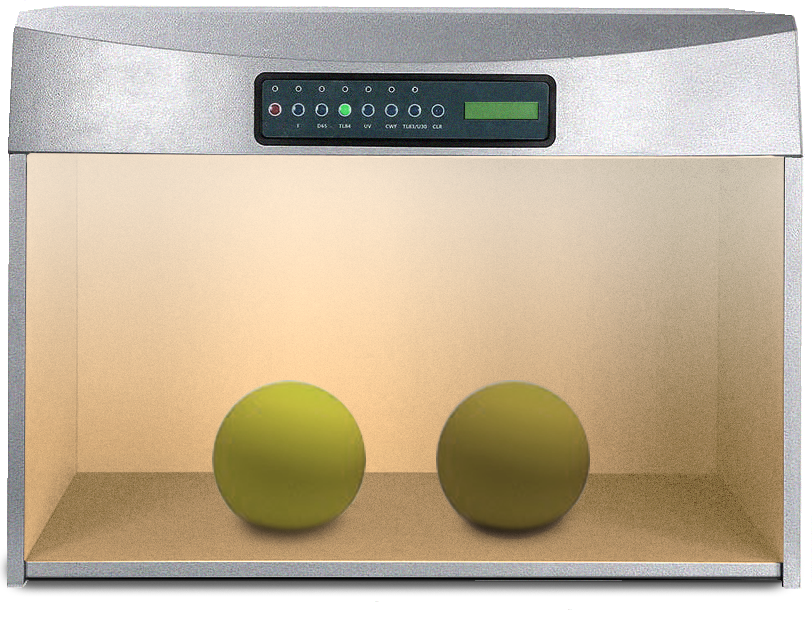
Here we show two inks based on two different recipes based on different pigments.
Color Inspector with its Tracing tool can be used to detect metamerism. U1 is measured as a reference, then U2 is measured. Both inks at D50 look similar, but different when Lighting changes.
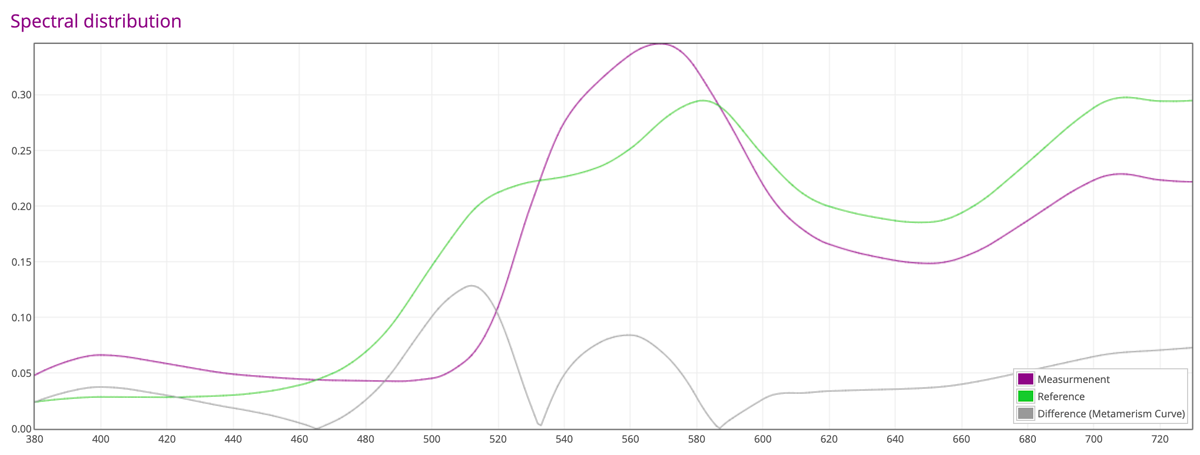
Color Inspector plots a gray metamerism curve that is a spectral difference (showing the perceived delta difference) between U1 and U2. It is easy to understand which sections of the spectrum are more sensitive to metamerism phenomena. Any significant differences between Lighting Conditions in those areas will produce large perceived color differences.
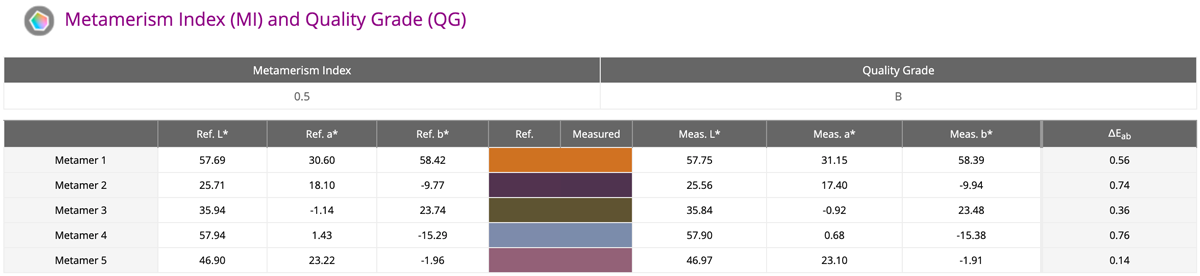
Metamerism Index and Quality Grade
ISO 3664 lighting evaluation (Lighting Inspector) consists of five virtual metameric pairs which are used for calculations. All pairs come from the real world (printing) and represent the most typical issues related to metamerism phenomena in the graphic industry.