Introduction to QuickChecker Interface
CC Capture’s QuickChecker interface offers a straightforward way to measure, compare, and track colors. It is designed for immediate measurement in the Scratchpad area, with tools to store and compare against master color references.
Interface Overview
The QuickChecker window is divided into four main areas that work together in every measurement session:
- Scratchpad — temporary workspace showing the last 24 hours of measurements
- Inspector’s Bar — selects which CC Capture Inspector is active
- Action Bar — triggers measurement, calibration, and evaluation modes
- Measurement & Compare Report — displays results and comparisons against references
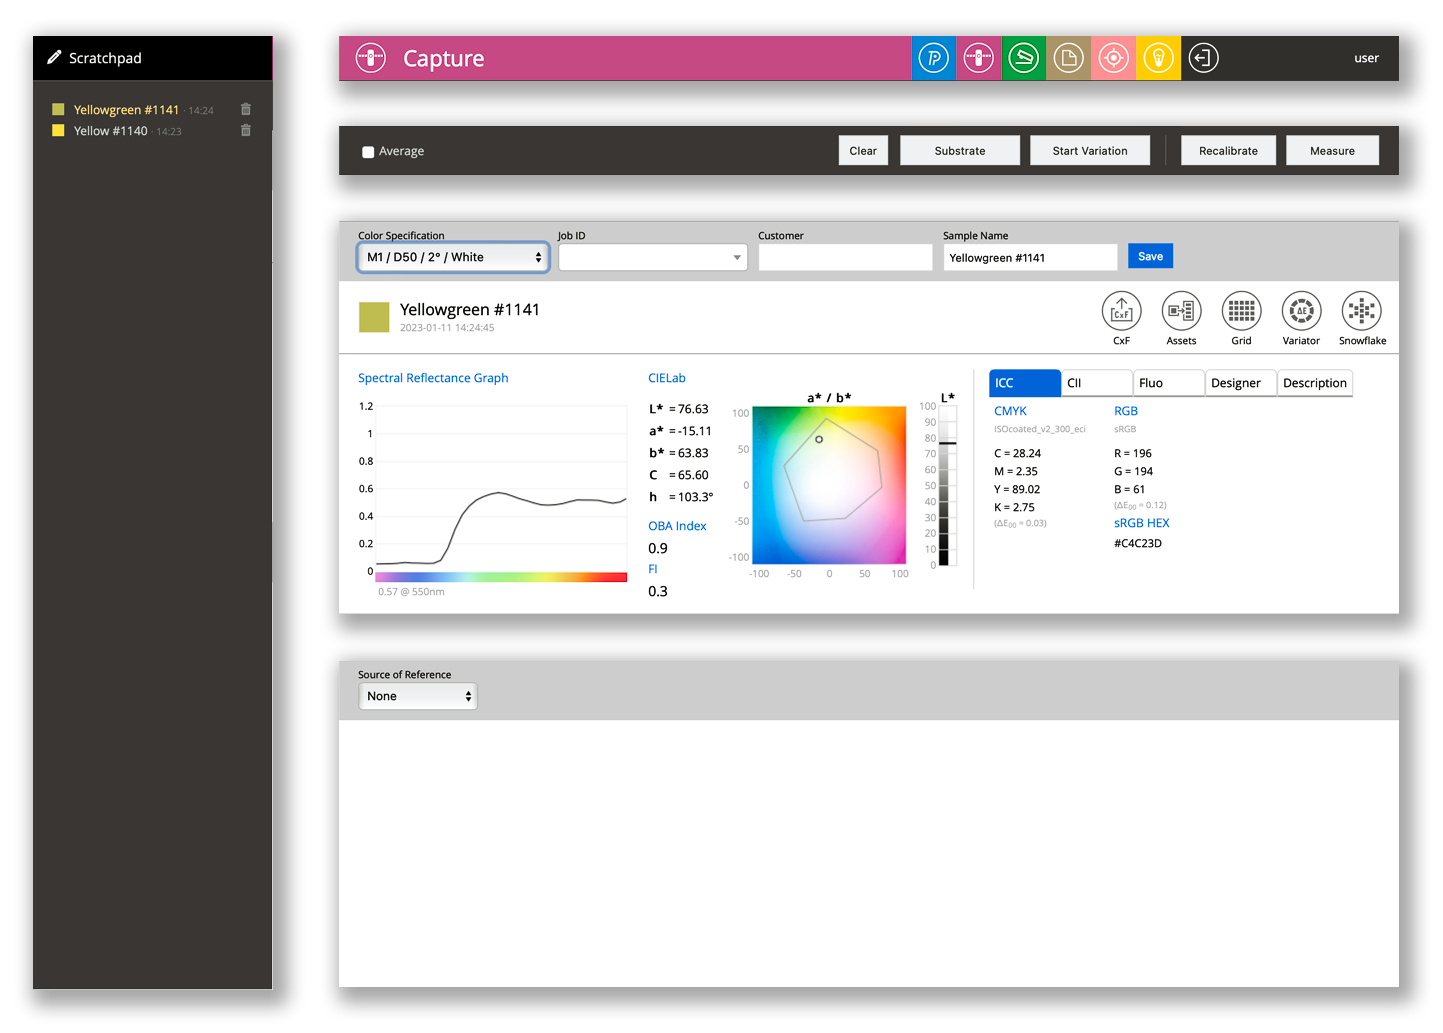
Scratchpad
The left-side workspace displays measurements from the preceding 24 hours. Clicking any measurement highlights it in yellow and shows its full detail in the report panel. A trash icon allows deletion of incorrect readings.
All measurements are auto-named with a serial number. The operator can override this name at any time. Measurements that are not saved to Assets are automatically deleted after 24 hours.
Inspector’s Bar
This bar lets operators select the active CC Capture Inspector for the current session. Access to specific Inspectors is controlled by permissions set in the Accountability Inspector. Each Inspector can be designated as the default tool for a given operator or workstation.
Action Bar
The Action Bar provides buttons for each measurement mode available in the current session:
- Measure — triggers a standard single measurement
- Calibrate — invokes instrument calibration procedure
- Start Variation — measures a series of readings to quantify within-sample uniformity
- Substrate — evaluates the measurement relative to the substrate white point
- Clear — resets the current session settings
- Average checkbox — when enabled, only the averaged result is stored (not individual readings)
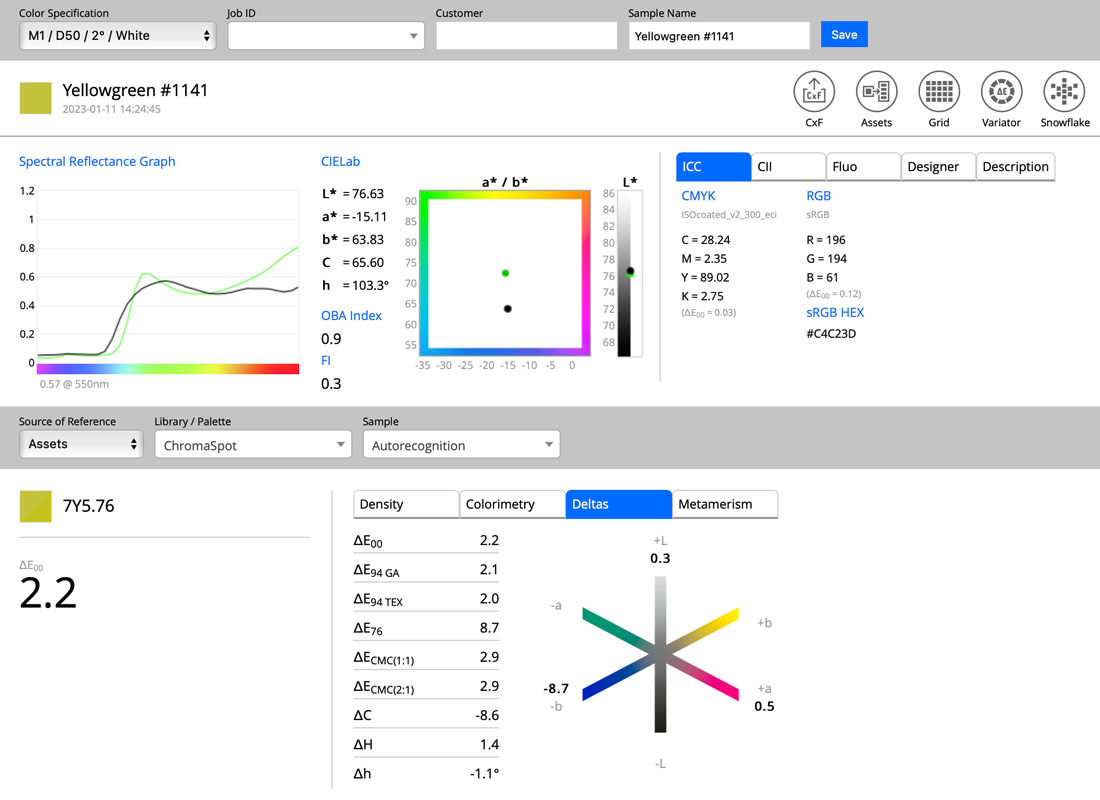
Measurement Report
After each measurement, the report panel displays the color data: spectral graph, colorimetric coordinates (L*a*b*, LCh, XYZ), and OBA/Fluorescence indices where applicable.
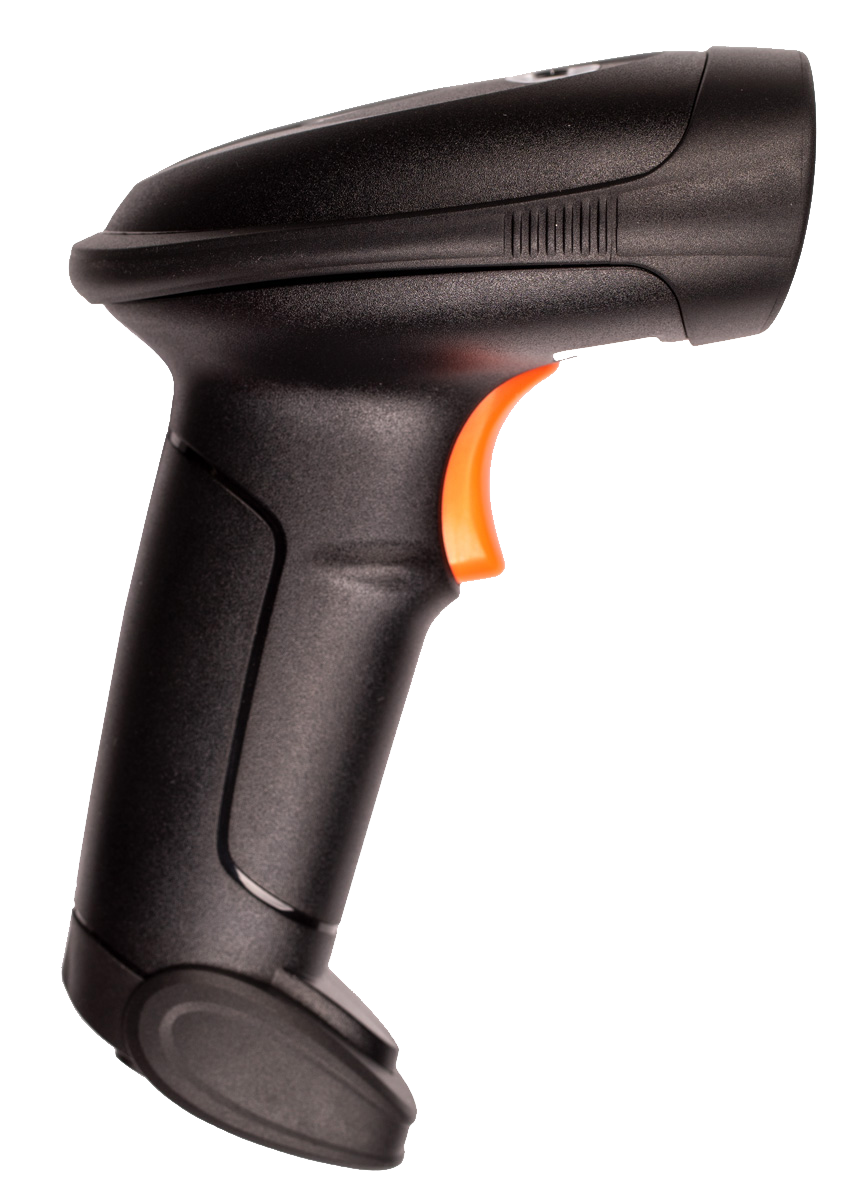
Optional descriptor fields — Color Specification, Job ID, Customer, Sample Name — can be filled manually or populated automatically via barcode scanner or the CC-2D barcode reader accessory.
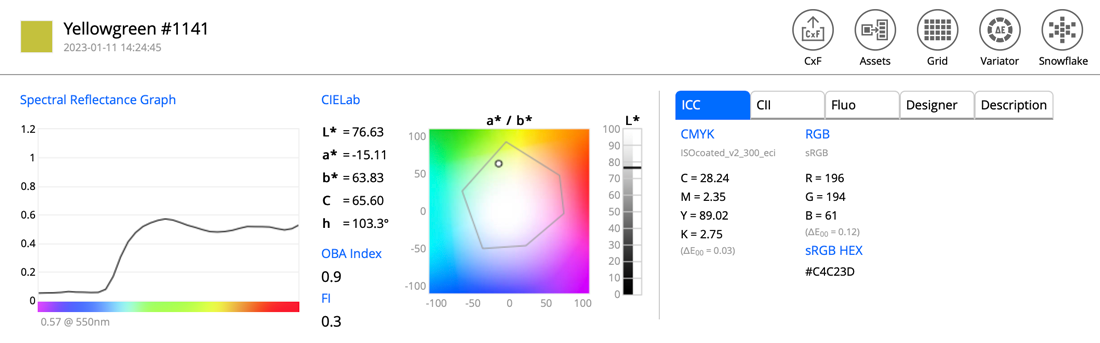
From the Measurement Report you can launch additional tools directly:
 Export to CxF
 Save to Assets
 The Grid
 ΔE Variator
 Snowflake
Compare Report
The Compare Report evaluates the measured color against a reference. References can come from multiple sources: